Convert data into insightsinstantly with Illutix
The tool you need to build visualizations that wow clients... at 10x speed

Everything you need to visualize smarter.
One platform. One flow.
Features you'll love
Check out some of our features that'll drive your team's success.

Crafted for real collaboration
No more screenshots or static exports. Work live with your team, tweak views together, and watch insights unfold in real time.

Driven by context
Drill down without getting lost. Apply dynamic filters and sorting to zoom in, zoom out, and find exactly what matters, when it matters.
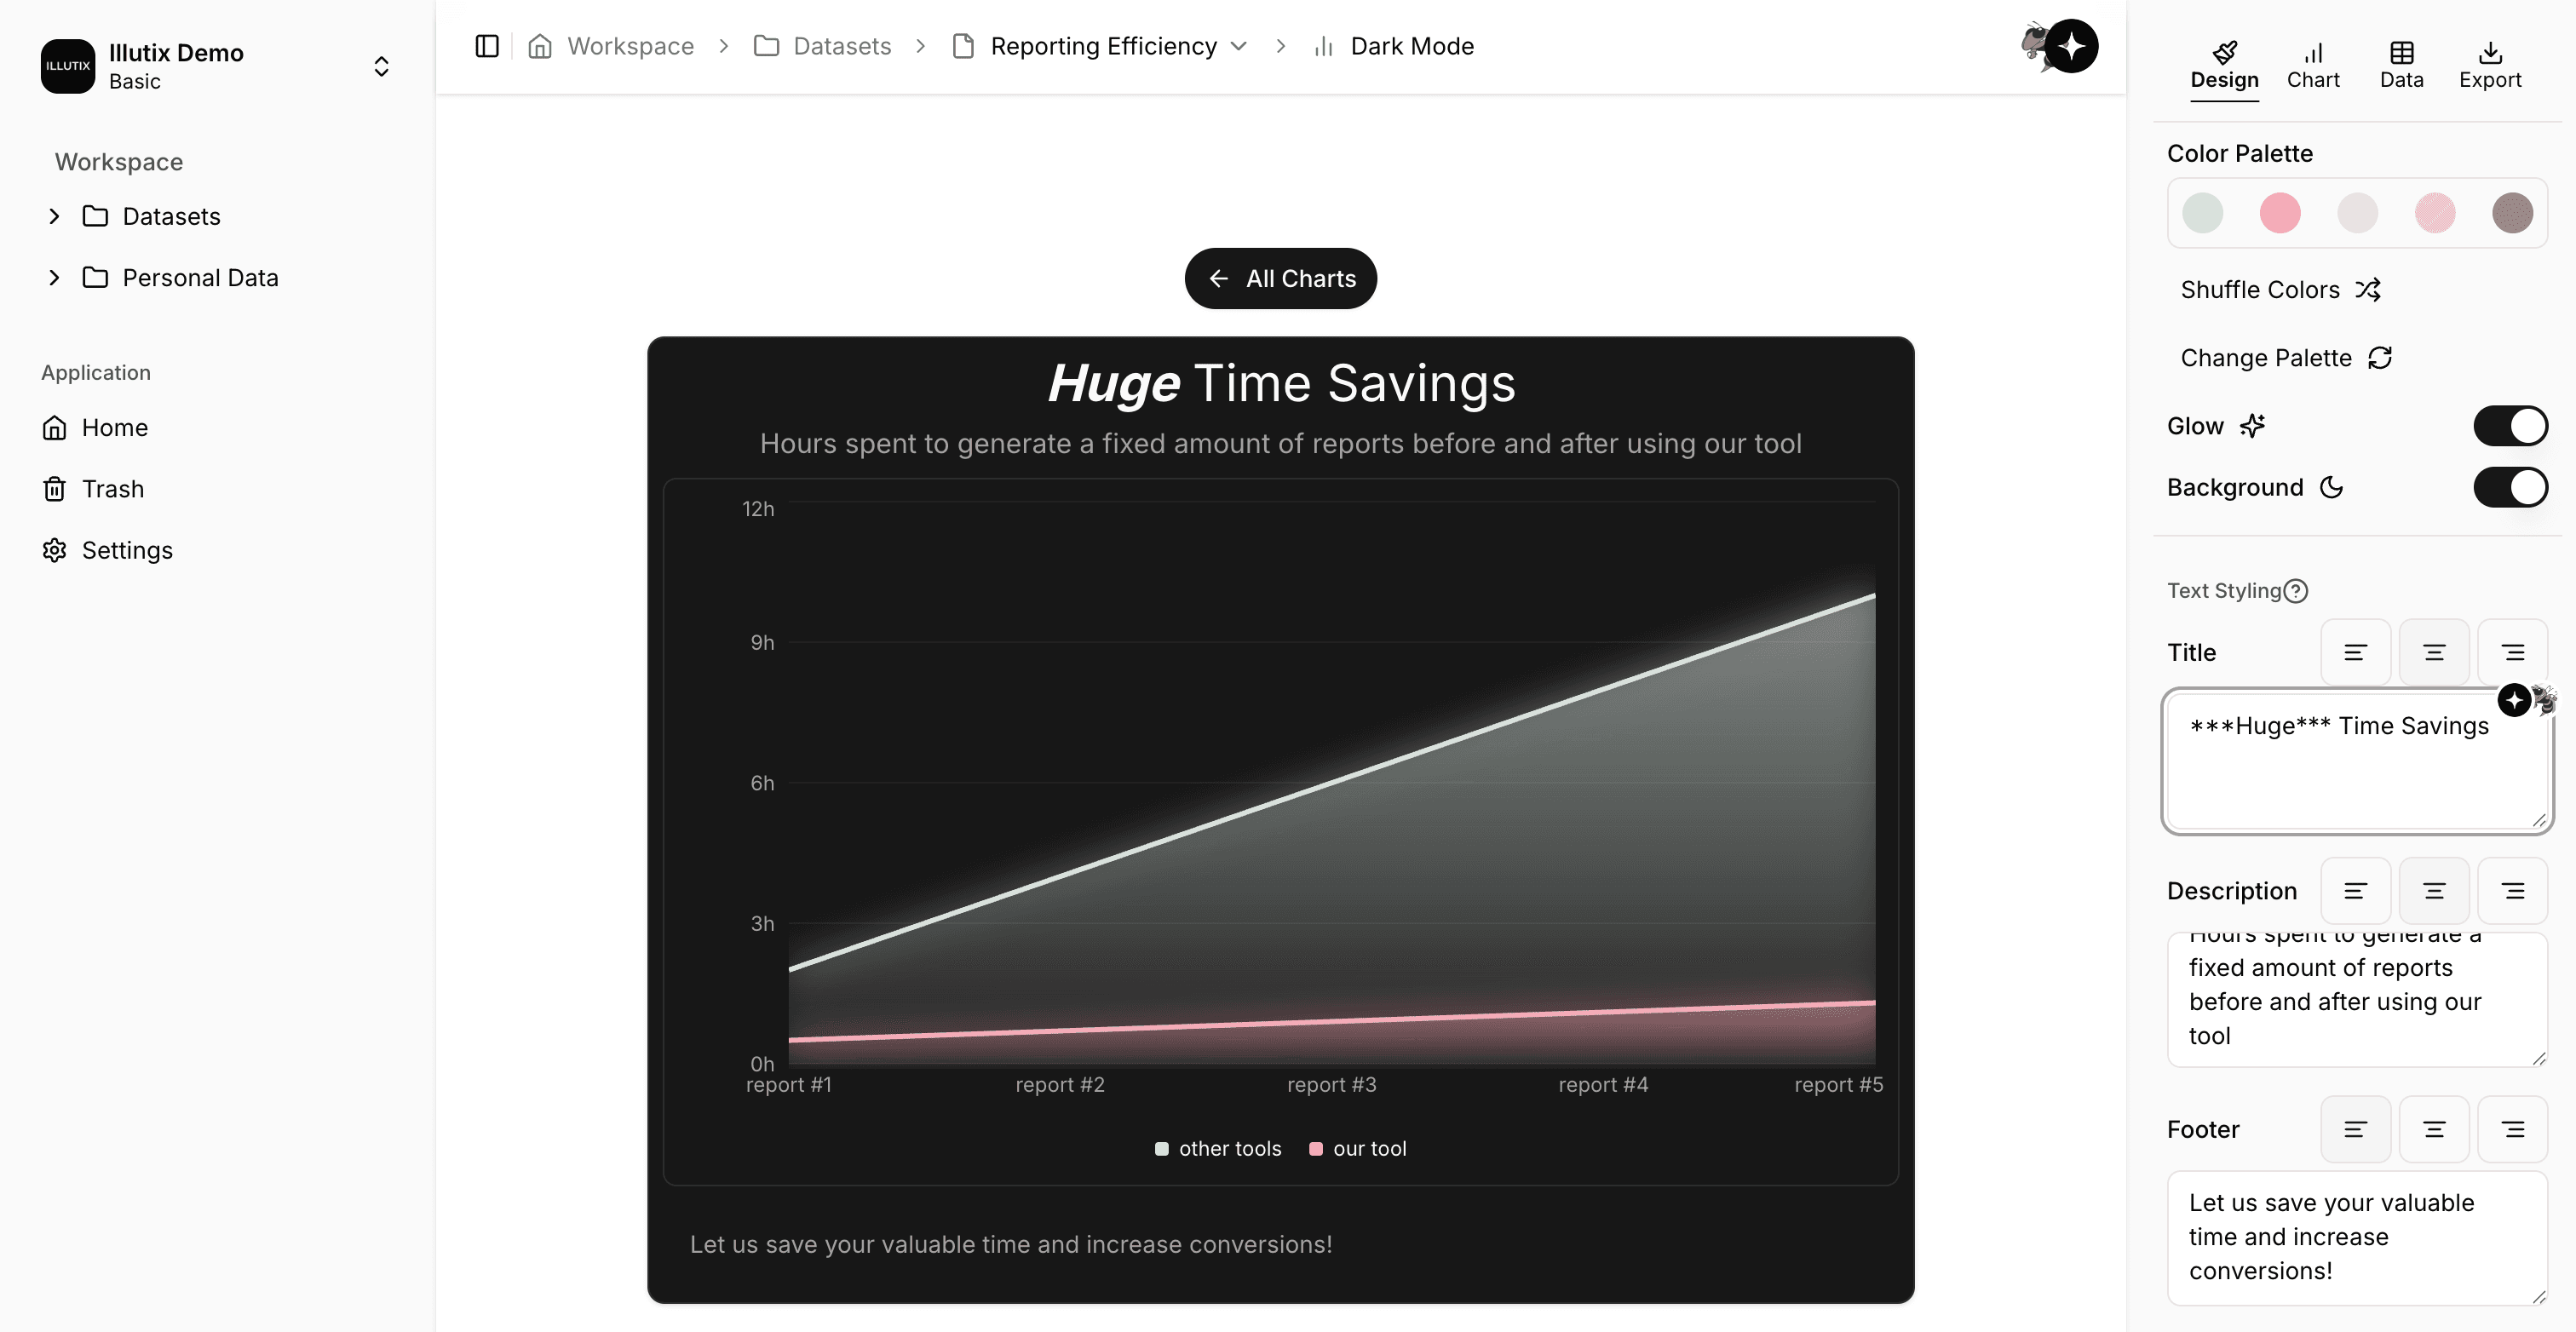
- Custom Color Palettes
- Change annotations
- Drag and Drop columns
- No code
Your data. Your flow.
Customize everything. Share securely. And go from raw data to polished chart — without writing a single line of code.

